You can run this notebook in ![]() , in
, in ![]() .
.
First steps
Import the package
you may need to install the package
pip install mapgpye
[1]:
from magpye import GeoMap
Create your first map
[2]:
geomap = GeoMap()
Add a coastlines object
[3]:
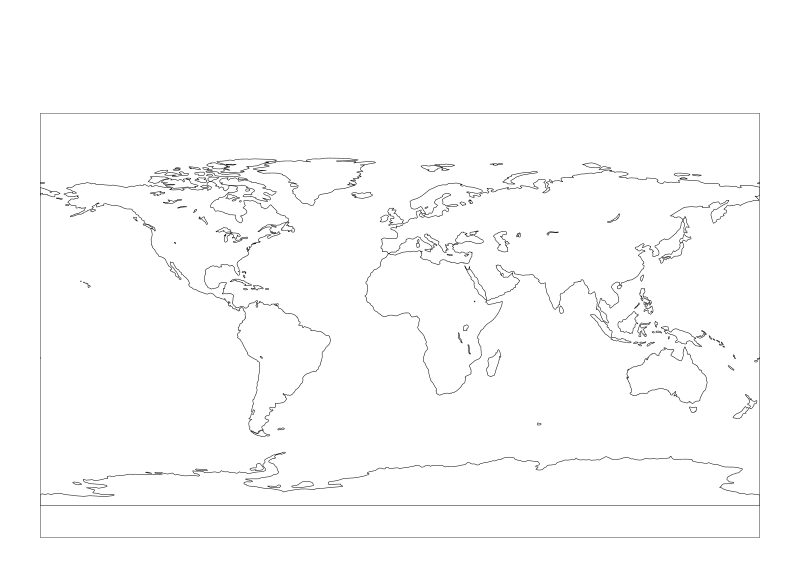
geomap.coastlines()
Call the show method to render the object
The coastlines will be rendered using all the defaut values on the default geographical area/projection ie over the globe on cylindrical projection : EPSG:4326
[4]:
geomap.show()
[4]:
Tailor your plot
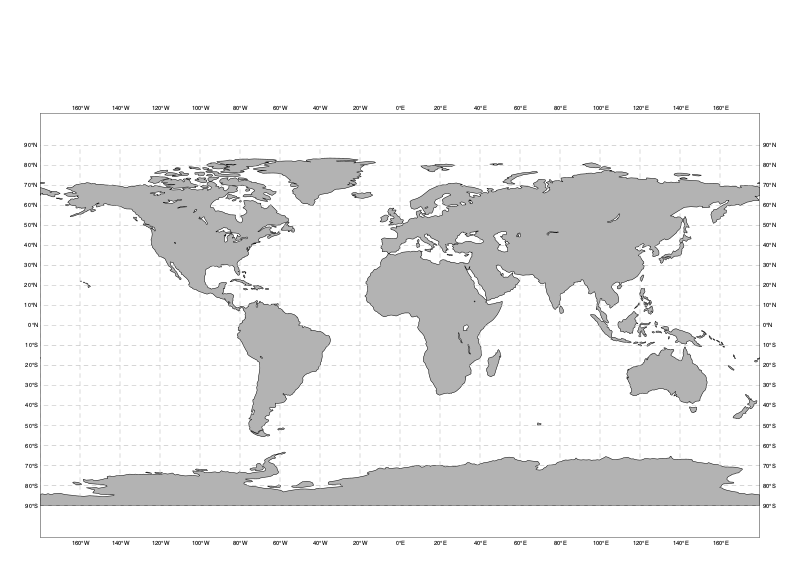
Change the visual attributes of the coastlines
[5]:
geomap = GeoMap()

geomap.coastlines(land_colour="grey")
geomap.gridlines(line_colour="grey", line_style="dash")

geomap.show()
[5]:
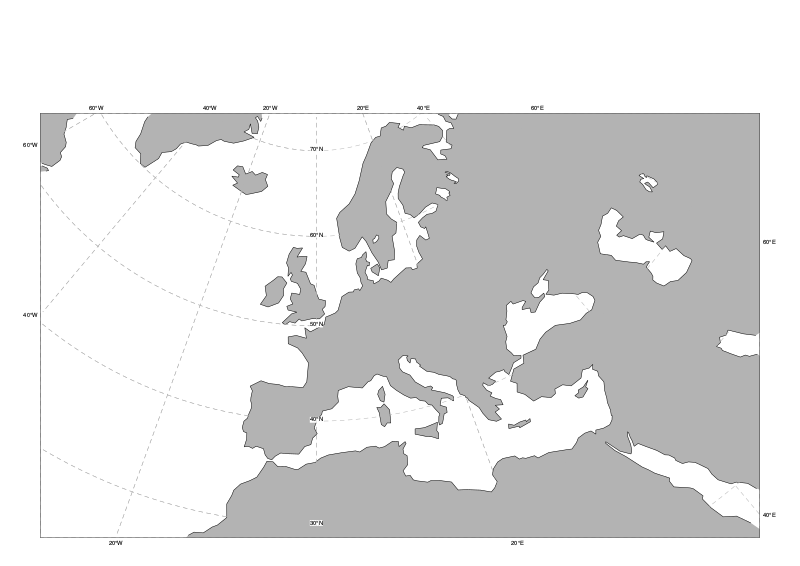
Change the geographical area
Magpye offers a set of predefined areas. You can select one when creating the map.
[6]:
geomap = GeoMap(area_name="europe")

geomap.coastlines(land_colour="grey")
geomap.gridlines(line_colour="grey", line_style="dash")

geomap.show()
[6]:
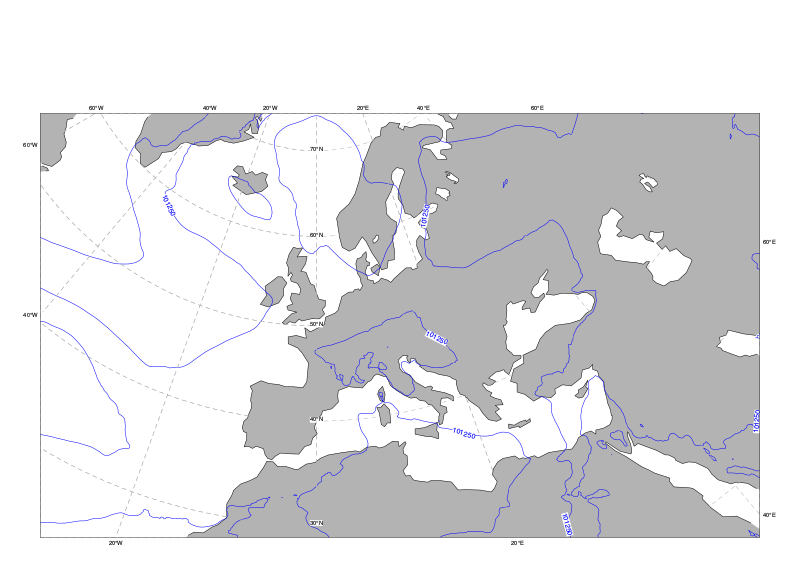
Add a geographical field
Your data is in a file called mslp.grib –> mean sea level pressure coded in grib.
This default visualisation is a set of blue isolines
[7]:
geomap = GeoMap(area_name="europe")

geomap.coastlines(land_colour="grey")
geomap.contour_lines("mslp.grib")
geomap.gridlines(line_colour="grey", line_style="dash")

geomap.show()
[7]:
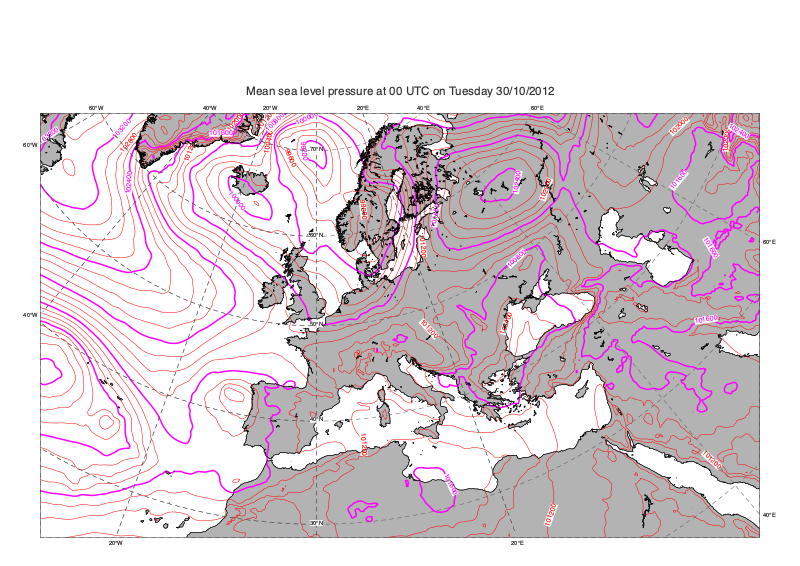
Tweak the plot
You can now change the visualisation settings of the contour_lines method. In this example :
- We will increase the sresolution of the coastlines
- Change the colour of some isolines and highlight some in purple
- Plot a line every 200 (starting at 0) with highlights every 4 lines
- Add a title
[9]:
geomap = GeoMap(area_name="europe")

geomap.coastlines(resolution="high", land_colour="grey")

geomap.contour_lines(
    source="mslp.grib",
    line_colour="red",
    highlight_colour="purple",
    interval=200,
    interval_reference=0,
    highlight_frequency=4,
)

geomap.coastlines(resolution="high")
geomap.gridlines(line_style="dash", line_colour="#555555")

geomap.title("Mean sea level pressure at 00 UTC on Tuesday 30/10/2012")

geomap.show()
[9]:
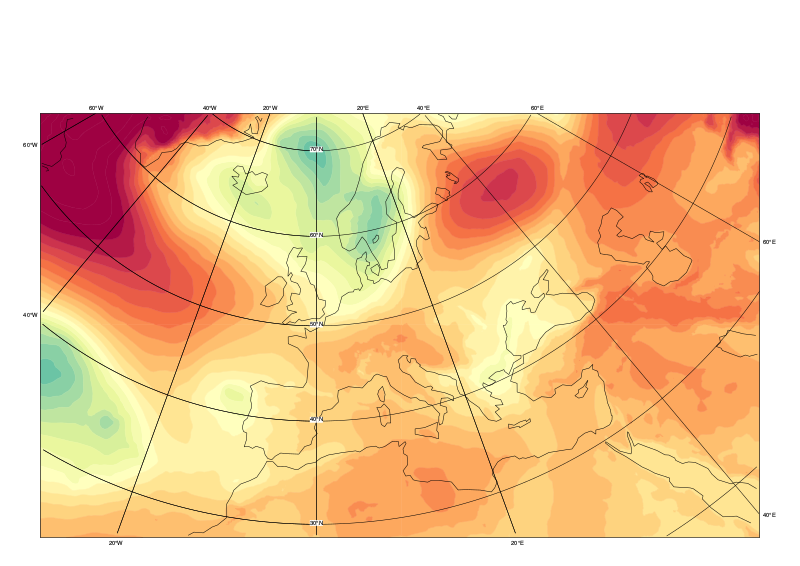
Use preset
GeoMap methods can take a ‘preset’ argument, which automatically populates certain arguments with pre-defined values for convenience
[14]:
geomap = GeoMap(area_name="europe")


geomap.contour_shaded("mslp.grib", preset="demo", legend=True)
geomap.coastlines(preset="default")
geomap.gridlines(preset="default")

geomap.show()
[14]:
[ ]:
[ ]: