You can run this notebook in ![]() , in
, in ![]() .
.
Styles in magpye
Here is the gallery of the predefined styles, more to come soon …
Isolines
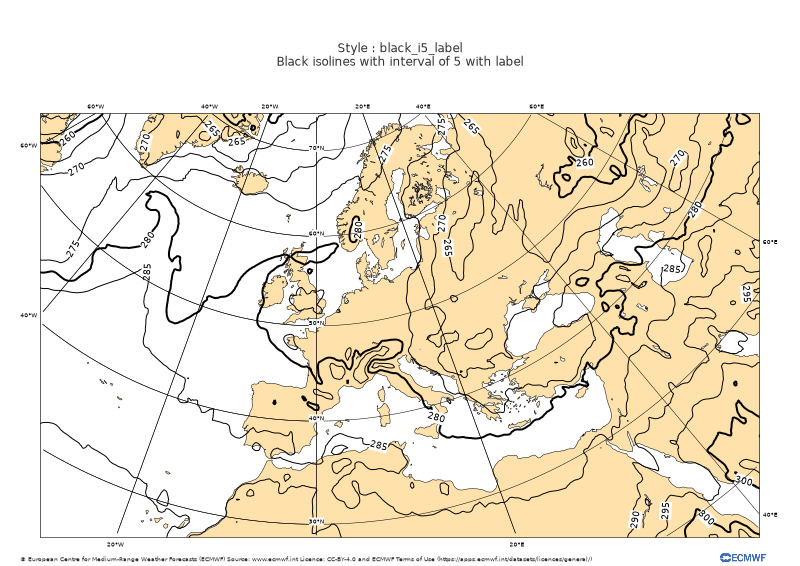
black_i5_label
Black isolines with interval of 5 with label
[1]:
from magpye import GeoMap

fig = GeoMap(area_name="europe")

fig.coastlines(land_colour="cream",resolution="medium")
fig.contour_lines("iso.grib", style="black_i5_label")
fig.gridlines()

fig.title(
    [
        "Style : black_i5_label",
         "Black isolines with interval of 5 with label"
    ]
    )
fig.legend()
fig.footer("© European Centre for Medium-Range Weather Forecasts (ECMWF) Source: www.ecmwf.int Licence: CC-BY-4.0 and ECMWF Terms of Use (https://apps.ecmwf.int/datasets/licences/general/)", logo='ecmwf')

fig.show()
[1]:
black_i5_LH
Black isolines with interval of 5
[2]:
from magpye import GeoMap

fig = GeoMap(area_name="europe")

fig.coastlines(land_colour="cream",resolution="medium")
fig.contour_lines("iso.grib", style="black_i5_LH")
fig.gridlines()

fig.title(
    [
        "Style : black_i5_LH",
         "Black isolines with interval of 5"
    ]
    )
fig.legend()
fig.footer("© European Centre for Medium-Range Weather Forecasts (ECMWF) Source: www.ecmwf.int Licence: CC-BY-4.0 and ECMWF Terms of Use (https://apps.ecmwf.int/datasets/licences/general/)", logo='ecmwf')

fig.show()
[2]:

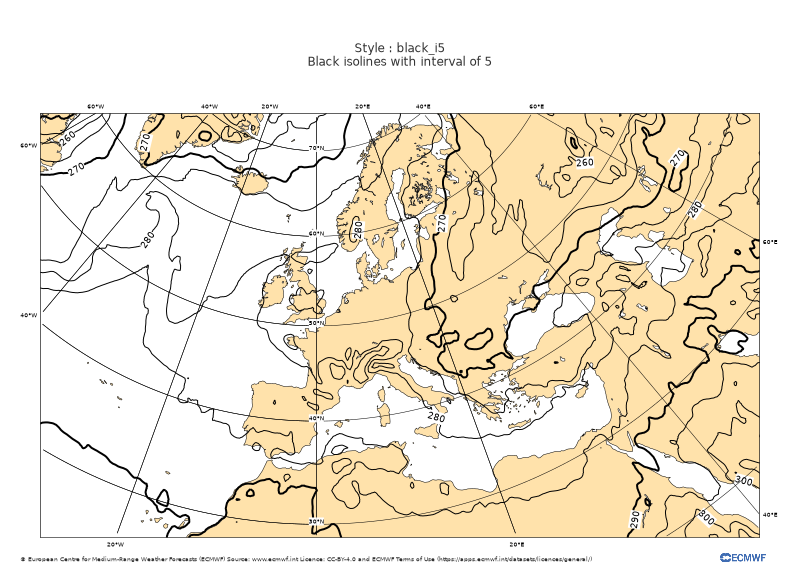
black_i5
Black isolines with interval of 5
[3]:
from magpye import GeoMap

fig = GeoMap(area_name="europe")

fig.coastlines(land_colour="cream",resolution="medium")
fig.contour_lines("iso.grib", style="black_i5")
fig.gridlines()

fig.title(
    [
        "Style : black_i5",
         "Black isolines with interval of 5"
    ]
    )
fig.legend()
fig.footer("© European Centre for Medium-Range Weather Forecasts (ECMWF) Source: www.ecmwf.int Licence: CC-BY-4.0 and ECMWF Terms of Use (https://apps.ecmwf.int/datasets/licences/general/)", logo='ecmwf')

fig.show()
[3]:
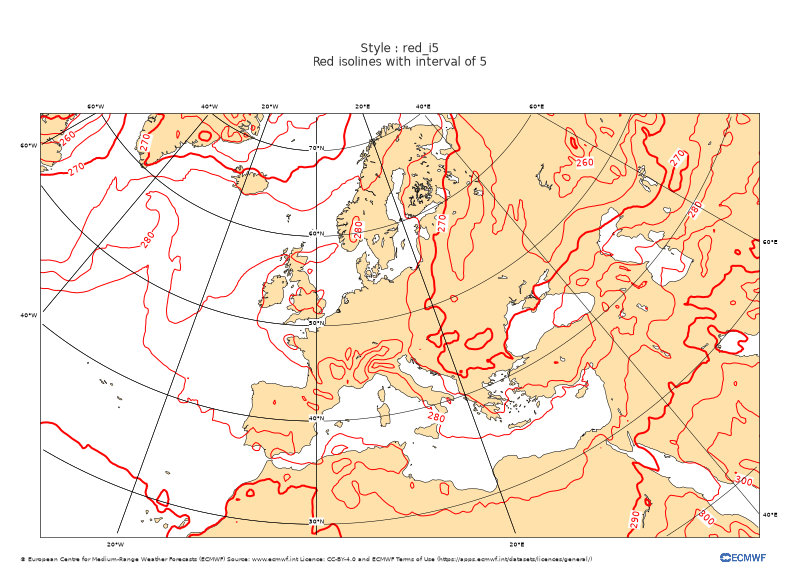
red_i5
Red isolines with interval of 5
[4]:
from magpye import GeoMap

fig = GeoMap(area_name="europe")

fig.coastlines(land_colour="cream",resolution="medium")
fig.contour_lines("iso.grib", style="red_i5")
fig.gridlines()

fig.title(
    [
        "Style : red_i5",
         "Red isolines with interval of 5"
    ]
    )
fig.legend()
fig.footer("© European Centre for Medium-Range Weather Forecasts (ECMWF) Source: www.ecmwf.int Licence: CC-BY-4.0 and ECMWF Terms of Use (https://apps.ecmwf.int/datasets/licences/general/)", logo='ecmwf')

fig.show()
[4]:
Shading
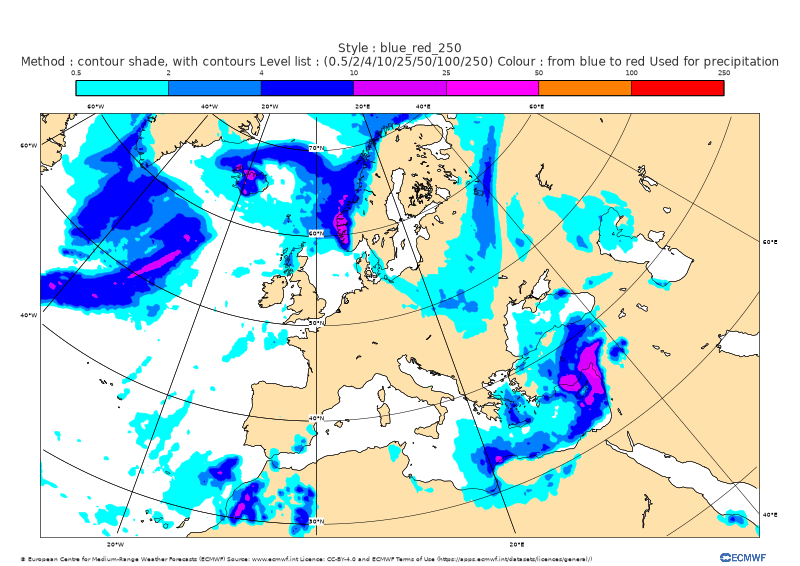
blue_red_250
Method : contour shade, with contours Level list : (0.5/2/4/10/25/50/100/250) Colour : from blue to red Used for precipitation
[5]:
from magpye import GeoMap

fig = GeoMap(area_name="europe")

fig.coastlines(land_colour="cream",resolution="medium")
fig.contour_shaded("tp.grib", style="blue_red_250")
fig.coastlines(resolution="medium")
fig.gridlines()

fig.title(
    [
        "Style : blue_red_250",
         "Method : contour shade, with contours Level list : (0.5/2/4/10/25/50/100/250) Colour : from blue to red Used for precipitation"
    ]
    )
fig.legend()
fig.footer("© European Centre for Medium-Range Weather Forecasts (ECMWF) Source: www.ecmwf.int Licence: CC-BY-4.0 and ECMWF Terms of Use (https://apps.ecmwf.int/datasets/licences/general/)", logo='ecmwf')

fig.show()
[5]:
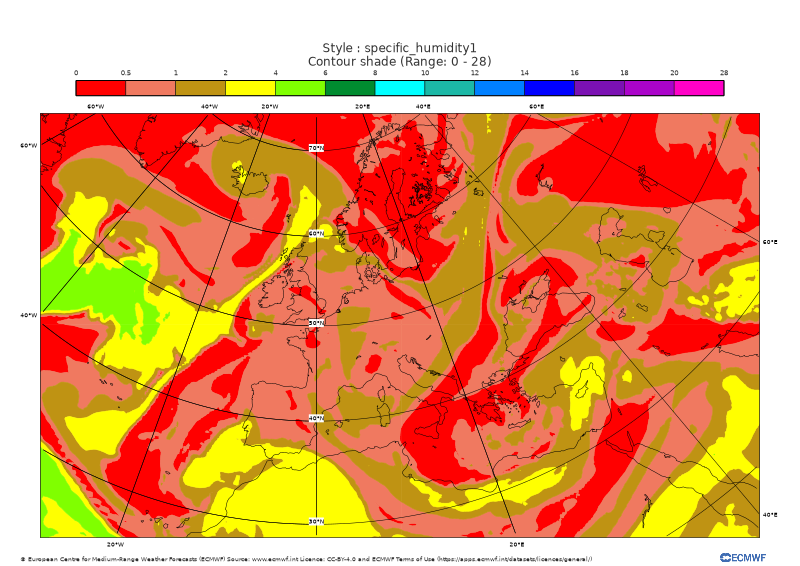
specific_humidity1
Contour shade (Range: 0 - 28)
[6]:
from magpye import GeoMap

fig = GeoMap(area_name="europe")

fig.coastlines(land_colour="cream",resolution="medium")
fig.contour_shaded("specific_humidity1.grib", style="specific_humidity1")
fig.coastlines(resolution="medium")
fig.gridlines()

fig.title(
    [
        "Style : specific_humidity1",
         "Contour shade (Range: 0 - 28)"
    ]
    )
fig.legend()
fig.footer("© European Centre for Medium-Range Weather Forecasts (ECMWF) Source: www.ecmwf.int Licence: CC-BY-4.0 and ECMWF Terms of Use (https://apps.ecmwf.int/datasets/licences/general/)", logo='ecmwf')

fig.show()
[6]: